We have received some questions about missing features in the Debugger.
In VO you had the ability to open windows in the debugger to see the list of open workareas, settings or privates. In X# we don't have these options yet. However the Visual Studio debugger is very powerfull and with the help of some clever watch settings you can see almost everything (until we have written a dedicated window for this).
Open workareas
To see the open workareas of an application, add a watch with the following contents(note that this is CaSe SenSiTiVe):
XSharp.RuntimeState.Workareas
I did this in the transported Explorer example just after opening the files and then the result is this:

You can see that there are 2 aliases opened. If you expand that then you'll see their names and workarea numbers.
The Current workarea is of type DBFNTX and has an alias Orders
The RDDs property show all the RDDs that are open at this moment.
Global Settings
To retrieve the global setings add the following watch
XSharp.RuntimeState.GetInstance()
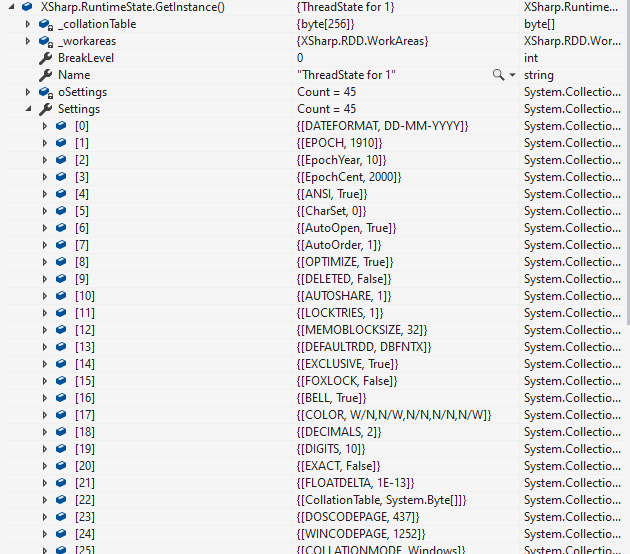
This shows you most of the settings of the current thread. All settings are stored in a collection named "Settings" as a pair where the key is the member of the Set Enum and the value the actual value.
On my machine this looks like:

Please note that these settings are "per thread".
Public and Private memory Variables
If you want to see the Public and Private memory variables you can do something similar. Take the following example code (compiled in VO dialect with Memvars enabled and Undeclared Variables enabled):
USING System
USING System.Collections.Generic
USING System.Linq
USING System.Text
FUNCTION Start() AS VOID STRICT
 PUBLIC MyBook
 PRIVATE MyQuestion
 MyBook := "The Hitchhiker's Guide to the Galaxy"
 MyQuestion := "What is the answer to the Ultimate Question Of Life, The Universe and Everything ?"
 Test()
 WAIT
 RETURN

FUNCTION Test() AS LONG
 PRIVATE MyAnswer
 MyAnswer := 42
 ? MyBook
 ? MyQuestion
 ? MyAnswer
 RETURN MyAnswer
Add the following code to a watch window to see the public and private variables:
XSharp.MemVar

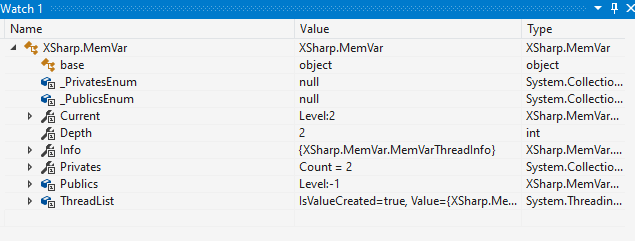
I have stopped the code inside the Test() function and there you can see that there is 1 Public and 2 levels of Privates. The current level is # 2.
When you expand the Publics property you will see a collection of name / value pairs.
If you expand the Privates property you will see a stack of 2 MemVarLevels (the Start() function and the Test() function). The current level is shown in the Current property of XSharp.MemVar. Each level will hold a collection of name/value pairs for each private variable.
Please note that the private Memory variables are maintained "per thread". That is why you see some thread information in this window as well. Public memory variables are visible in all threads, as you would expect.
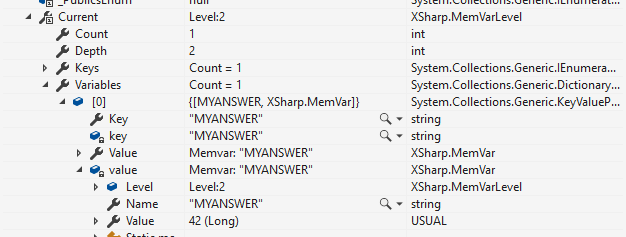
Drilling into the memory variables of the current level you will see the variable MYANSWER and its value 42:

And finally, to answer the question that you were afraid to ask:
Yes we will try to add "standard" debugger windows for this kind of information. Eventually it will come, but I must admit that it is not very high on our priority list (except when we find a sponsor for this feature of course....)

